 |
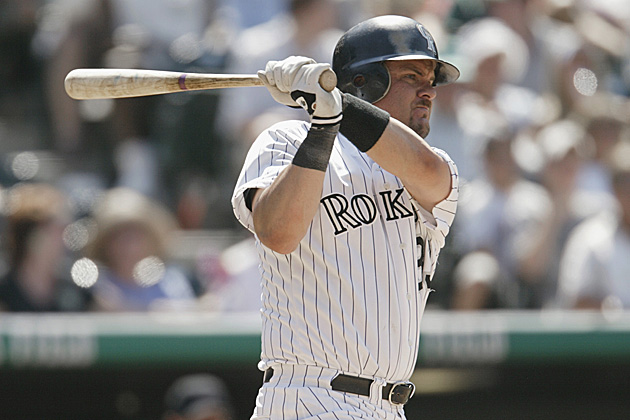
| Walker definitely enjoyed great success in Coors Field. (Getty Images) |
In our continuing series on the Hall of Fame candidates for this year's ballot, Larry Walker is being examined Thursday. As part of Walker's case, we simply cannot ignore what Coors Field did for his numbers. It has to be part of the argument, even if you're pro-Walker.
Thus, without passing judgment in this space, we will simply present the numbers and allow you to make your own judgments.
First, the Coors Field factor. Throughout its existence, Coors Field has ranked among the top hitters' parks in the majors. Even post-humidor, it routinely sits in the top five -- usually top three, actually -- in ESPN.com's Park Factor and was No. 1 last season. For most of the time that Walker was there, Coors was even more drastically hitter-friendly than it is now. Per the Rockies' website, the average score in 1999 was 8-7. That season, the Rockies and their opponents combined for 303 homers in Coors, a big-league record for one ballpark in one season.
Next, here are the counting stats -- meaning those that are raw numbers and accumulate. Take note that we are counting Walker's entire career and only pulling out when he played in Coors Field. So these aren't his home/away splits. He played plenty of home games for the Expos, some for the Cardinals and also visited Coors Field as an opposing player a few times.
| Walker's counting stats (key at the bottom of the page) | ||||||
| Larry Walker | PA/AB | HR | RBI | R | XBH | TB |
| In Coors Field | 2,501/2,136 | 154 | 521 | 555 | 363 | 1,516 |
| Outside Coors Field | 5,529/4,771 | 229 | 790 | 800 | 553 | 2,388 |
Note that Walker had more than twice as many plate appearances and at-bats outside Coors. Considering that, he's awfully close in the other categories.
For a better look, here are some rate stats -- meaning those that require a calculator:
| Walker's rate stats (key at the bottom of the page) | ||||||
| Larry Walker | AVG/OBP/SLG | AB/HR | RBI/G | R/G | AB/XBH | TB/G |
| In Coors Field | .381/.462/.710 | 13.87 | 0.87 | 0.93 | 5.88 | 2.54 |
| Outside Coors Field | .282/.372/.501 | 20.83 | 0.57 | 0.58 | 8.63 | 1.72 |
So, there you have it. Draw conclusions with impunity.
Key
PA: Plate appearances
AB: At-bats
HR: Home runs
RBI: Runs batted in
R: Runs scored
XBH: Extra-base hits
TB: Total bases
AVG: Batting average
OBP: On-base percentage
SLG: Slugging percentage
AB/HR: At-bats per home run (lower is better)
RBI/G: RBI per game (higher is better)
R/G: Runs per game (higher is better)
AB/XBH: At-bats per extra-base hit (lower is better)
TB/G: Total bases per game (higher is better)
For more baseball news, rumors and analysis, follow @EyeOnBaseball on Twitter, subscribe to the RSS feed and "like" us on Facebook.
![[object Object] Logo](https://sportshub.cbsistatic.com/i/2020/04/22/e9ceb731-8b3f-4c60-98fe-090ab66a2997/screen-shot-2020-04-22-at-11-04-56-am.png)


